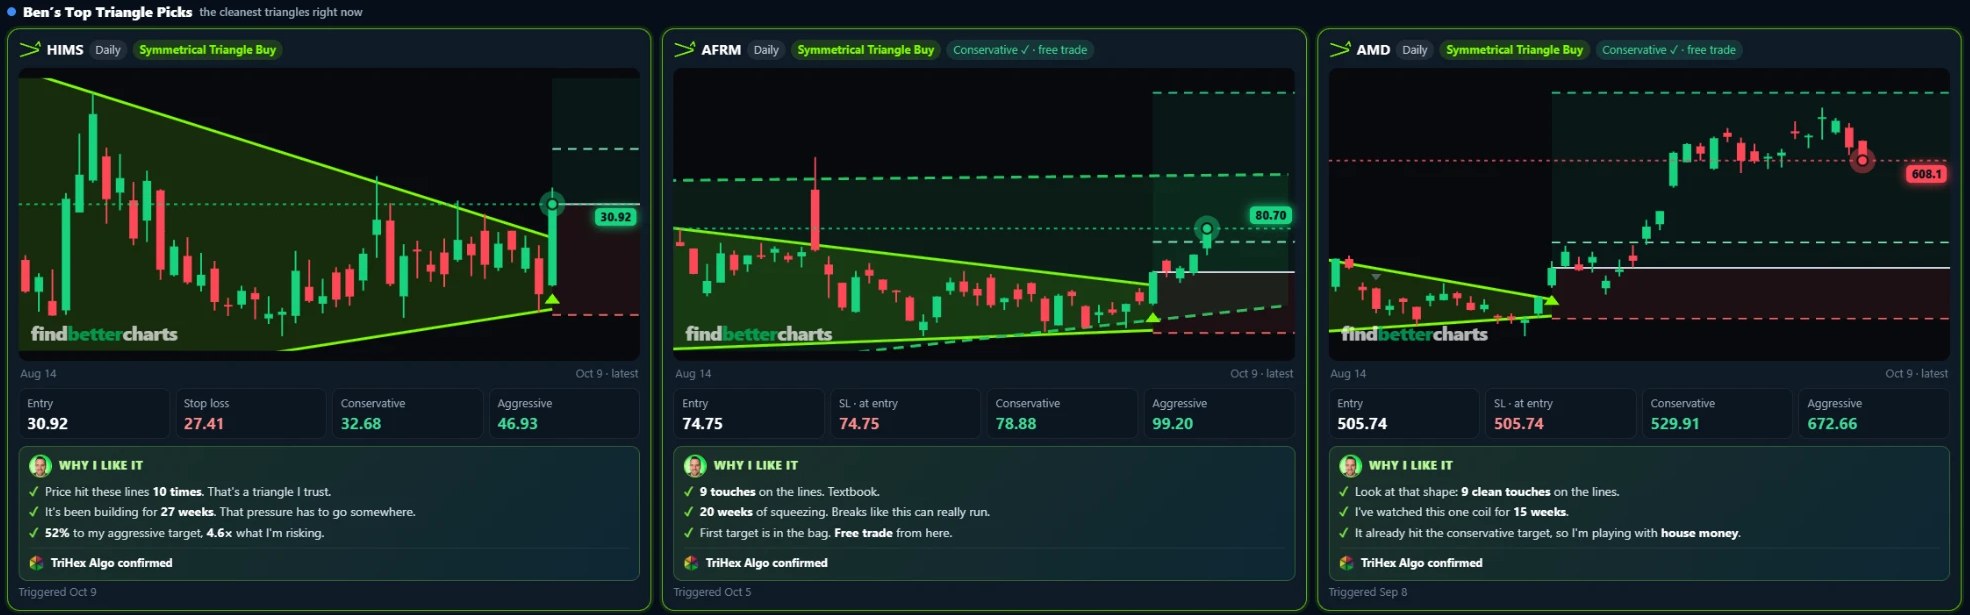
TriTrader+ finds the six triangle patterns I trust most and flags the break the moment it happens: on TradingView, on your own charts, and now on TriTrader+ Live, on our very own charts, with the entry, the stop and both targets on every call.
One payment. No subscription. The crossed-out price is what it goes to when the drop ends.
Hey folks, Ben here.
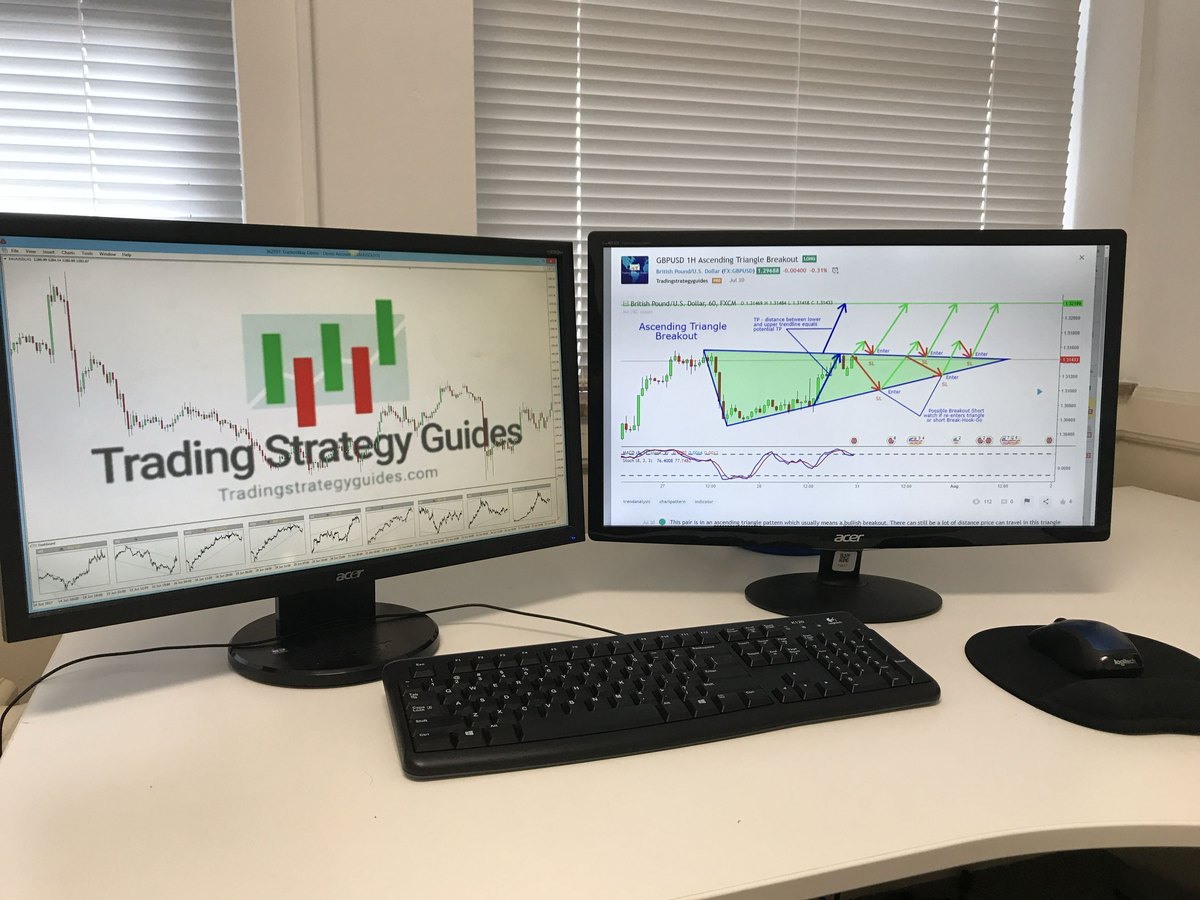
Triangles have been my thing for a long time. This is me in 2017, at my desk in the old Trading Strategy Guides office, with an ascending triangle on GBP/USD drawn on the screen by hand. Every trendline, every touch, one at a time.

I loved that pattern then and I love it now. The problem was never finding them. Here's what kept happening:
I'd open a chart and see it clear as day. A perfect triangle. Clean trendlines, tight compression, an obvious breakout coming.
And by the time I checked back on it, the move had already happened. Like this one on $AAPL, back in July 2024:

I wasn't missing these because I didn't know how to find them. I was missing them because I didn't have time to catch them. Too many tickers, too many timeframes, real life in between.
With TriTrader+ on the chart, that breakout is drawn as it happens:

So I took the six triangle patterns I trust most, the ones that lead to real trades and real follow-through, and built an algo that finds them for me.
It's powered by my TriHex Analysis Code, built from the ground up to find the exact structure that makes a triangle work.
And it runs on a 0.0001 precision factor that locks onto the candle highs and lows, so every trendline is clean, every angle is right, and the breakout is flagged on time. No hand-drawing. No guessing which line counts.

I built the TriHex Algo to draw a triangle the way I would, every time, on every chart, without me sitting there. Here's exactly what it does on every candle close:
It marks the real swing highs and swing lows: a high with lower candles on both sides, a low with higher ones. No guessing which wick counts.
It runs a line through the swing highs and another through the swing lows, locked to the candle highs and lows with the 0.0001 precision factor. A line only stands if price respects it, and the two lines need at least five touches between them.
From how the two lines slope, it knows which of the six triangles it is looking at: Symmetrical, Ascending, Descending, Falling Wedge or Rising Wedge.
No call until price closes through the line, not just pokes through it. On the daily it wants a decisive close, a triangle tall enough to matter, and a rising market.
The entry at the close, the stop under the lower line, a conservative target where half comes off and the stop moves to your entry, and an aggressive target at the triangle's own height.
Every call that clears all five gets the TriHex Algo confirmed stamp. That's what you'll see on every card in TriTrader+ Live.

This is the part I'm most excited about.
Ever since I started trading I've wanted one thing: our own charts. Not borrowed. Not rented. Ours, with our indicators built right into them, doing the watching for you. That's been the goal for over a decade.
It's here. Me and my team rebuilt TriTrader+ from the ground up on our own charts, and TriTrader+ Live is waiting in your members area the minute you join.
It's the first piece of Find Better Charts, the full charting platform we're building right inside the members area, where you'll pull up any chart yourself and switch on the indicators you own. That opens as a beta, free for every member, soon. You don't wait for it: TriTrader+ Live is yours today.
It scans the most-traded stocks and ETFs on the daily and 4-hour charts, draws every triangle with the TriHex code, and when one breaks the right way it calls it, with the entry, the stop, a conservative target and an aggressive target right on the chart. Nothing to install. It lives on our platform for good.
Buy triangles in place that have not broken yet.
Breakouts that passed the checks, each with its whole plan.
Every result kept on the record, wins and losses.
From our scanner: 251 stocks and ETFs on the daily and 4-hour charts · last run Mon, Oct 12, 5:19 PM ET

Real talk: the market data behind these charts costs us thousands of dollars a month. And this week you get TriTrader+ Live for $47 for two full years, or $97 for life. Just try it. I think you're going to love it.
And you still get the TradingView version for your own charts (TradingView changes its rules for sold indicators on November 1, which is one more reason we built our own).
Two things are changing, and both work in your favour if you move this week.
One: from November 1, TradingView changes its rules for indicators sold outside its own Marketplace, and it can change them again whenever it wants. That's exactly why we built our own charts. TriTrader+ Live lives there, so nobody can switch it off on us.
Two: this is TriTrader+'s week in the Indicator Bonanza. $47 for two years, or $97 for life. When the drop ends it goes up to $227, and on November 1 to full price.
Some of you trade the stock. Some of you want the option. So every TriTrader+ Live call on a big, heavily traded name now comes with an options play right on the card and in the alerts:
Real option closes from the signal's session to the exit's, on TriTrader+ Live calls. Past plays, not a promise about the next one.
The TradingView indicator comes with it, for your own charts. Every line on these charts was drawn by TriTrader+, not by hand.

Pretty easy, right? Take the signal, buy the stock or the option you prefer, and you are lined up for the breakout:

It works the other way too. A textbook Symmetrical Triangle on Nvidia:


Not every triangle on a chart is worth trading. The TriHex Algo doesn't just look for a shape. It looks for confluence:
That's how it tells a shape from a trade-ready setup. Each of the six has its own fingerprint:


Triangles aren't rare. They form on every market and every timeframe, and with TriTrader+ you're watching for six of them at once:

Here's something most indicator sellers won't tell you. We tested the sell side. A lot.
Nate on our team ran over 2 million backtests on triangles. Not one short version was profitable. Then we ran our own on top: more stocks, the 1-hour, quick 15-minute trades, one- and two-day holds, only on days the market was falling. The best version made about +0.05R a trade. That's a coin flip once you pay to trade it.
The reason is simple: the market rips. Stocks climb over time, and when one breaks down, buyers step in and snap it back.
So all six triangles are drawn on your charts, the sells included, so you see the whole picture. But TriTrader+ only calls the side that has paid: the buys. These are our best setups, and we're not going to mess with anything else just to look busy.

You're out at your favorite restaurant. Good food, good company, no charts in sight.
Then your phone buzzes. TriTrader+ just flagged a breakout on AAPL.
You take a quick look, make your call, and put the phone away for the rest of the meal.

Later, just before the close, you open your phone one last time. One alert, from a triangle you didn't even draw. That's what TriTrader+ is for.

Here's what you get today
The scanner on our own platform: the six triangles on the daily and 4-hour charts, calls with an entry, a stop, a conservative and an aggressive target, Ben’s Top Triangle Picks, and the record of every result.

The core engine. Add it to your charts in about a minute and it draws all six triangle patterns for you — any symbol, any timeframe.

Pick the patterns you care about. When a setup is confirmed and price presses on the breakout level, TradingView alerts you — desktop, phone or email.

A no-fluff walkthrough from zero to live setups, even if you have never used TradingView.

How the system is built: what each structure is telling you, why it picks its anchor points, how breakout levels are calculated, and how to plan a trade around the setup.

The anatomy of all six triangles on one page — where pressure builds, how momentum shifts, and the breakout zones the system watches.

Open a free TradingView account, load the indicator, lay out your chart like ours and switch on alerts — in under 10 minutes.

Ben walks through the cleanest triangle breakouts he has graded — what made them "A" setups, how the system picked them up, and how to spot one in seconds.

The panel on your chart now spells out the active setup, its direction, and the target and stop levels the moment a signal fires.
This is TriTrader+'s week in the Indicator Bonanza. Lifetime is $97, or two full years for $47. When the drop ends it goes up to $227, and on November 1 to full price.
Use TriTrader+ for 14 days. If it is not for you, ask through Support in your dashboard and you get every penny back. No questions asked.
The TriTrader+ scanner on our own platform, in your members dashboard. It watches our list of the most-traded US stocks and ETFs on the daily and 4-hour charts, draws every triangle it finds, and calls the breakouts that pass its checklist with an entry, a stop, a conservative target and an aggressive target. Nothing to install.
Anything you can chart on TradingView — stocks, ETFs, indexes, futures, commodities and more, on any timeframe.
Yes, on the big, heavily traded names. Each TriTrader+ Live call on one of them shows an at-the-money option (a call on a buy, a put on a sell) on a monthly expiry 60 to 90 days out, on the card and in the PRO Alerts. Trade the stock or the option; your call.
Yes. The TradingView indicator has BUY and SELL alerts built in that take about 30 seconds to switch on. And if you want every TriTrader+ Live call on your phone the moment it fires, TriTrader+ PRO Alerts (offered right after checkout) posts each one to your own private room on Discord and Telegram.
TriTrader+ Live runs in your members dashboard, on any device. The indicator is for TradingView (a free account works).
No. Either plan is one charge, once: Lifetime is $97, for life; 2-Year Access is $47, for 2 full years of access, and it never renews or charges again. No monthly or yearly charges.
Right away. Your access email arrives within a minute or two, and the thank-you page has a button that takes you straight into your members dashboard.
In your Find Better Trades members dashboard, next to the indicator, the guides and the bonuses.
It depends on the timeframe. On the lower timeframes most setups play out over one to three days. The training covers the timeframes we use.
No. Triangles break both ways. Three of the six patterns are long setups and three are short setups, so there is something to watch up, down or sideways.
You have 14 days for a full refund, no questions asked: just ask through Support in your dashboard.

P.S. I've been drawing triangles for most of my trading life. TriTrader+ Live on our own charts is the version I always wanted: the triangles found for me, the whole plan on the chart, and nothing anyone can switch off.
It's $47 for two years or $97 for life until Thursday at midnight ET. After that it goes up. I'd love to have you on it.
Ben